Cluster chart
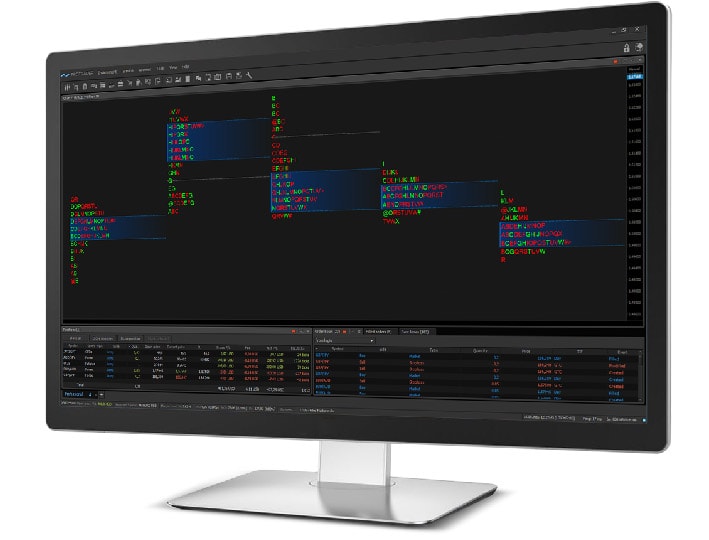
- displays volume data in a cluster bar view
- evaluates strength of the market participants
- allows customizing data filters for clear vision
Bar Statistics
- shows extended volume data inside each bar
- calculates delta between buy and sell data
- allows setting up advanced custom filters
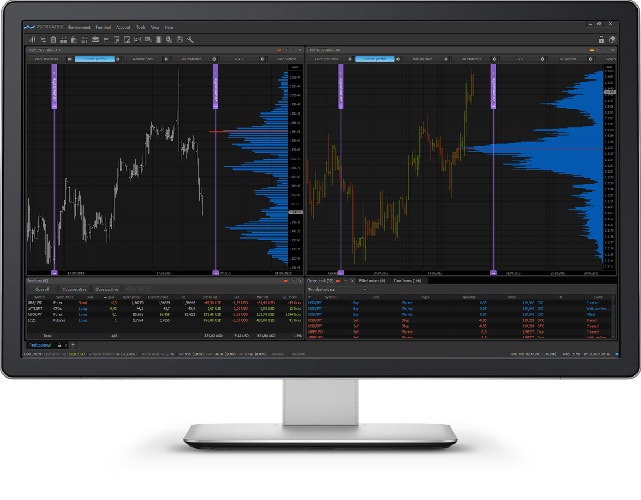
Price Statistics
- displays exact volume data on all price levels
- aggregates volume per selected period
- uses custom filters for volume data displaying
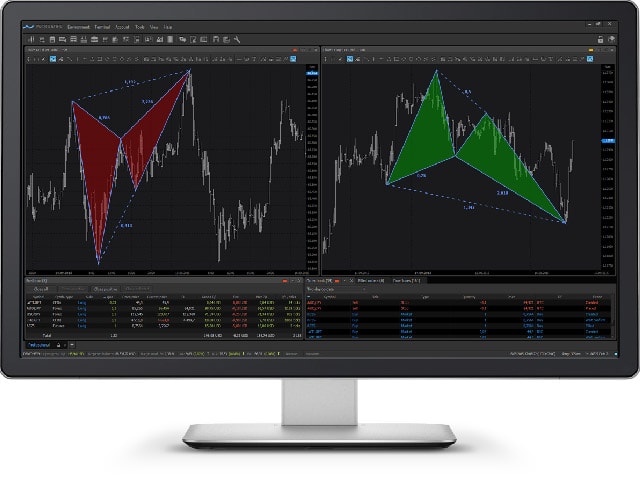
Price action tools
- identifies key price levels
- emphasizes the most powerful zones
- determines the reversal points
Seasonality
- widely used in the futures market
- shows seasonal cycles
- allows setting different number of years
… and much more
Scales
- allows setting up various price scales
- uses logarithmic scale for displaying large price movements
- displays price change in relative scale
Pattern analyzer
- searches and analyzes similar candle patterns
- evaluates the probability of future price movements
- calculates the potential width of the movement
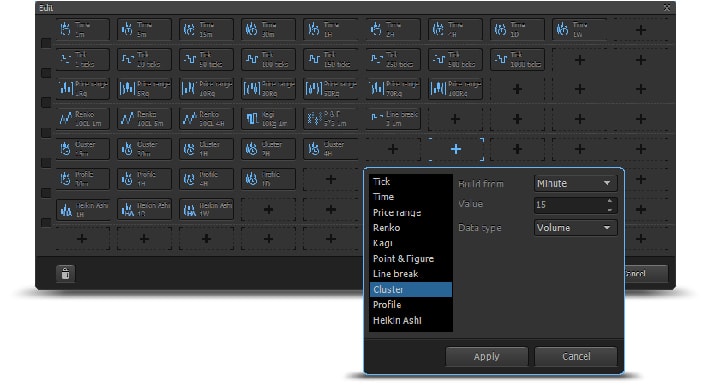
Chart types
- wide range of standard and advanced charts
- analyzes the market using time-based or count-based charts
Roman Nalivayko
Global Head of Business
Development
Development
Feel free to contact us if you have any questions
Contact Us

